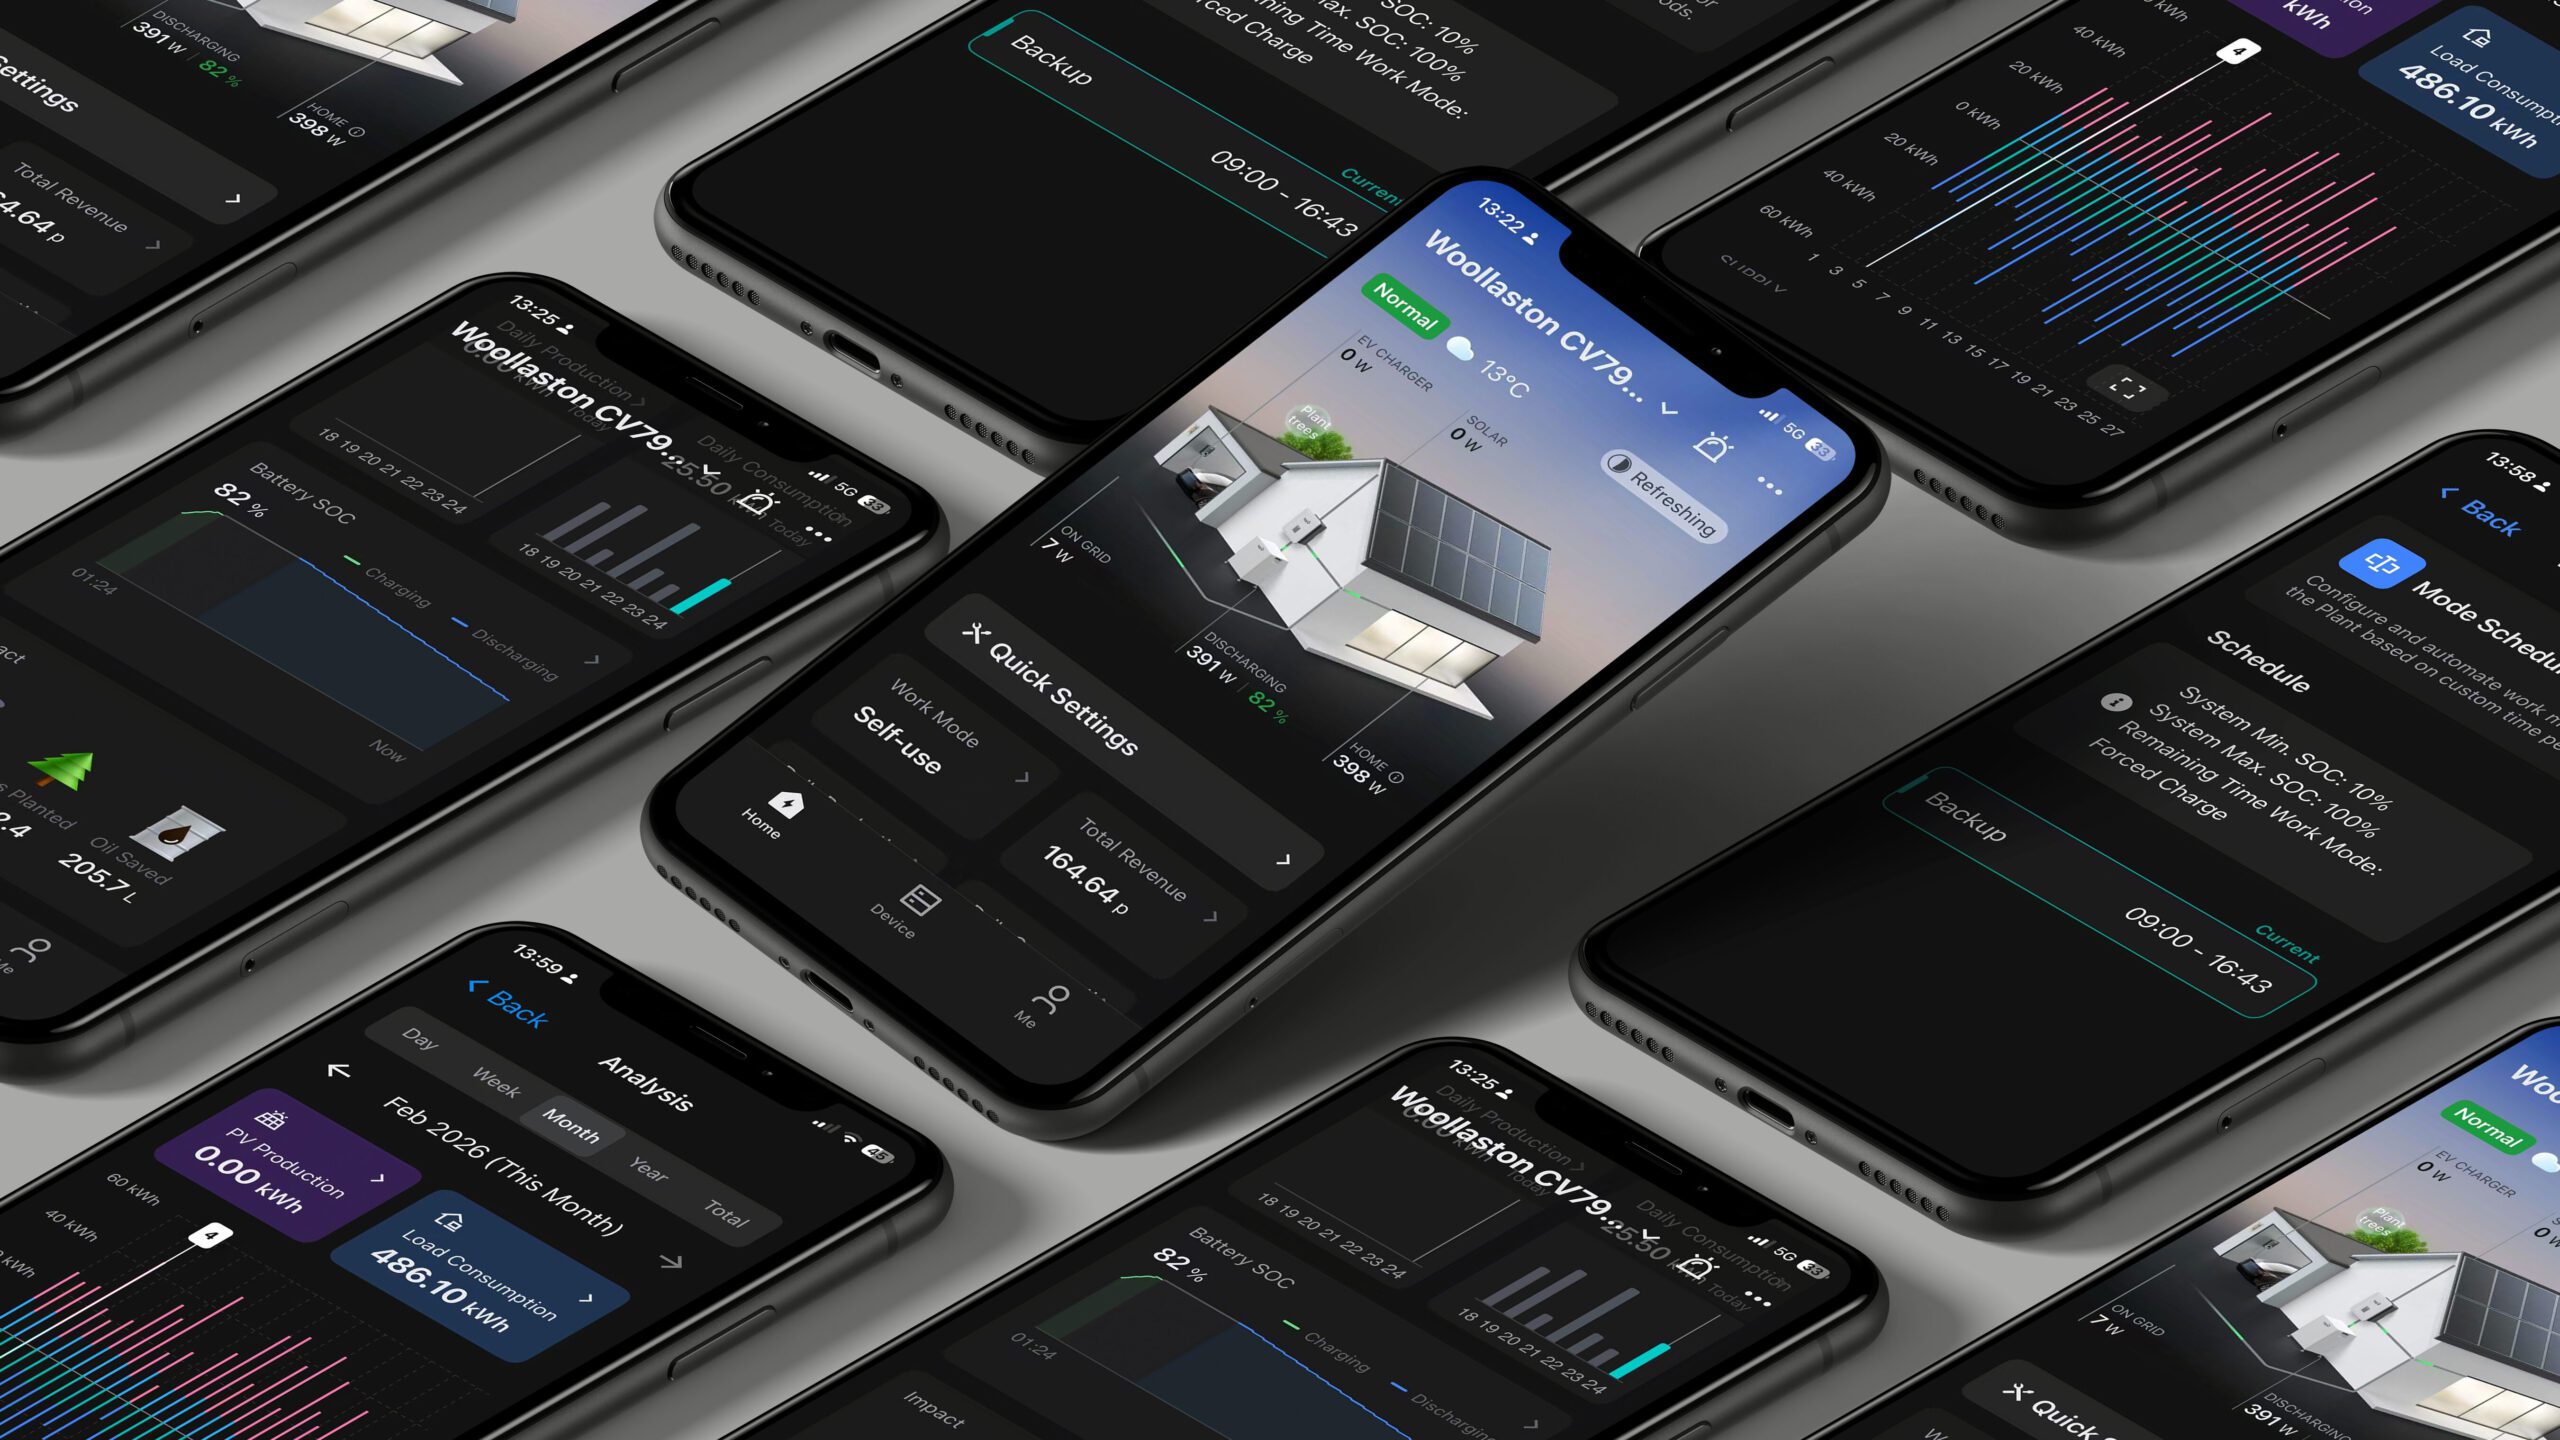
Issues where the system behaviour, as observed on the energy flow of the Fox Cloud app, is counter to what you would expect to see given the reported circumstances, might point to incorrect settings or a firmware mismatch. However, if you are only observing this on rare occasions, it could be explained by the data polling delay.
The data collected on the Fox Cloud is communicated at 5 minute data polling points – so this is just a snapshot; so if you were to compare the cloud data directly, say, with readings on the inverter screens they likely will not match.
The overall energy flow for the whole site is based on data captured once every 5 minutes; in other words you are seeing an accurate overall picture for the whole system at the point the inverter polls its data. There is the potential for very occasional data anomalies owing to the response time to state changes. For example, if you suddenly apply a heavy load in the property, it may take the inverter 1-2 seconds to respond to that change. If data polls at that precise moment that the inverter is reacting, the cloud display may appear to display an anomaly – e.g. it might indicate that energy is being imported rather than discharged from battery. In reality, this may have adjusted within half a second, but if the data is captured at that point, the customer will see an apparent anomaly for up to 5 minutes. This happens rarely, but is important to understand in order that you reassure customers who raise this query.
The overall (full system) energy flow provides a full system picture, but again this is a snapshot once every 5 minutes. Fox plan to increase the regularity of the polling points with the release of new cloud updates over coming months – so the communications will become more regular at that time.